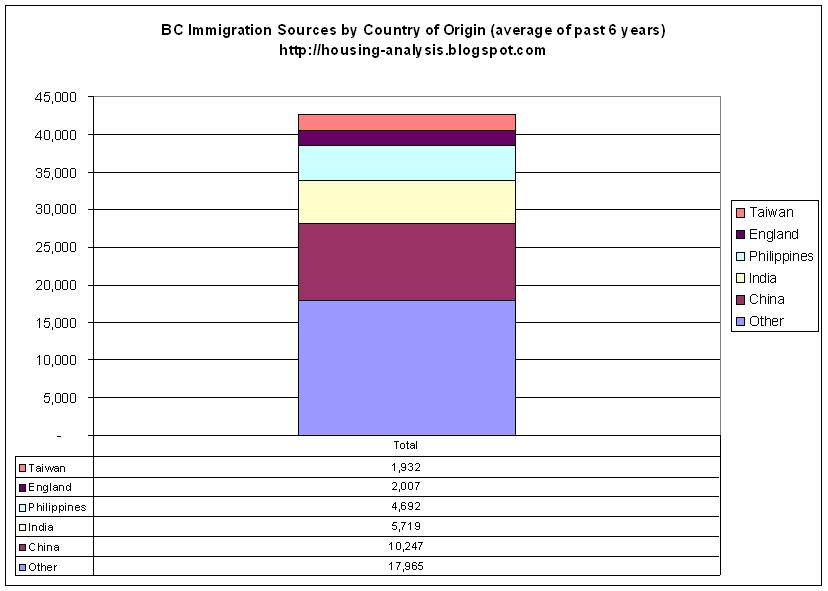
Continuing with population growth analysis, I have drilled into the immigration statistics (available here) and graphed the data of immigration sources by class and country of origin. First are immigration sources by percentage in a given class, the top five classes and countries by intake displayed:

We can see right away that China dominates the investor immigrant class; amongst countries in the "other" category heavily involved in this class are South Korea and Iran. The Philippines dominates the caregiver class. The other classes are more evenly distributed. Next we display all classes:


- 2/3rds of immigrants into BC are either skilled worker or family class applicants.
- 13% are investors and entrepreneurs. These classes include the main applicants' spouses or dependants.
- The provincial nominee program has a broad distribution of country of origination.
- China and Taiwan comprised 29% of immigrants into the province. Investors and entrepreneurs (mostly investors) from these two countries comprised 10% of immigrants into the province.
No comments:
Post a Comment